Unions push for $232 minimum wage by 2026 amid tripling living costs
| News Highlights |
Economy and Industry
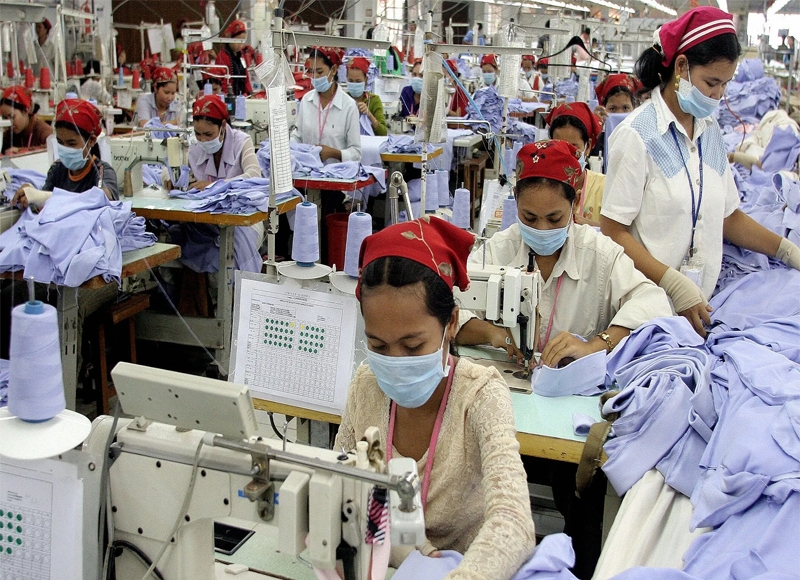
Unions push for $232 minimum wage by 2026 amid tripling living costs Non-governmental organisations and trade unions in Cambodia are demanding an urgent increase of the monthly minimum wage from $208 to $232 by 2026, asserting that the current wage is insufficient to cover the real cost of living. Citing reports, they state that workers' expenses for essential items far exceed their average income, forcing many into debt and preventing a dignified life. The organizations have called upon the National Minimum Wage Council, Ministry of Labour, and employers' associations to approve this proposed adjustment, with discussions planned between the ministry, unions, and factories. (Source: Kiripost)
Nearly $150M debt to China paid off by Cambodia in H1 Cambodia repaid $145.7 million in debt service to China in the first half of 2025, comprising $116.7 million in principal and $29 million in interest, despite a funding freeze since last year. China remains Cambodia's largest bilateral creditor, holding approximately $4.07 billion (over 32%) of Cambodia's total public debt. The country also secured a new $181.5 million loan from the Asian Infrastructure Development Bank (AIIB), a China-led multilateral lender, which had previously halted financing. This indicates China's continued influence through multilateral platforms, even as direct bilateral lending paused. Cambodia's debt sustainability hinges on its obligations to China and its engagement with diversified funding sources. (Source: Khmer Times)
Cambodia's solar exports shrink dramatically in H1 2025 Cambodia's solar panel manufacturing industry faces a significant crisis due to a sharp decline in exports, primarily caused by US tariffs. After a peak of $2.3 billion in 2023, total solar panel exports fell to $830 million in 2024 and a mere $4.4 million in the first quarter of 2025. This decline is largely attributed to tariffs imposed by the Biden administration in 2024 and a further 3,500 percent tariff by Donald Trump, effective June 2, 2025. Over 90 percent of Cambodia's solar exports are destined for the US market. Overall Cambodian exports of electrical machinery and equipment, which include solar panels, decreased by 34 percent year-on-year from January to July 2025. (Source: Khmer Times)
Corporate News
ABA and Grab partner to boost Cambodia's cashless ecosystem ABA Bank and Grab have enhanced their partnership by integrating ABA's PayWay payment gateway into the Grab superapp, enabling ABA customers to set default payment methods for quicker, more convenient transactions on Grab. This integration also allows Grab drivers to receive automatic, swift, and secure payouts directly into their ABA accounts. The collaboration aims to further streamline digital payments within Cambodia's growing digital economy, reflecting a mutual commitment to providing secure and user-friendly digital payment solutions. (Source: Cambodia Investment Review)
Stock Market
CSX index declines 0.32% as all main board stocks record losses On 04 September 2025, the CSX Index declined by 0.32% to close at 402.5 points. On the Main Board, no stock posted gains, while PAS (-0.83%), MJQE (-0.50%), CGSM (-0.41%), PWSA (-0.32%), and PPAP (-0.29%) recorded losses. GTI, PPSP, and ABC closed unchanged. On the Growth Board, DBDE and JSL fell by 0.49% and 0.36%, respectively. Total trading volume reached 43,056 shares, with a turnover of KHR 155 million. (Source: YSC Research)
| CSX Stocks |
CSX Index
| Value | 1D % Chg | 1D Vol | Mkt Cap (KHR'bn) |
| 402.49 | -0.32 | 43,056 | 10,795 |
Stock Performance
| Stock | Close (KHR) | 1D chg (%) | MTD chg (%) | YTD chg (%) | 1M high (KHR) | 1M low (KHR) | MTD vol (shr) | Mkt cap (KHR'bn) |
| PWSA | 6,220 | -0.32 | -0.32 | -2.20 | 6,260 | 6,180 | 13,106 | 541 |
| GTI | 7,120 | 0.00 | -0.56 | 40.16 | 7,180 | 6,760 | 6,928 | 285 |
| PPAP | 13,560 | -0.29 | -0.59 | -2.02 | 13,700 | 13,500 | 961 | 280 |
| PPSP | 2,050 | 0.00 | 0.00 | -5.53 | 2,100 | 2,050 | 20,517 | 147 |
| PAS | 12,000 | -0.83 | 0.00 | 3.81 | 12,140 | 11,920 | 2,254 | 1,029 |
| ABC | 6,780 | 0.00 | 0.00 | -10.08 | 6,860 | 6,760 | 49,278 | 2,937 |
| PEPC | 2,570 | -0.39 | -1.15 | 7.53 | 2,700 | 2,510 | 434 | 193 |
| MJQE | 1,980 | -0.50 | -0.50 | -4.81 | 2,000 | 1,980 | 30,846 | 642 |
| CGSM | 2,420 | -0.41 | -1.63 | -0.41 | 2,460 | 2,420 | 22,217 | 4,741 |
| DBDE | 2,030 | -0.49 | -0.49 | -1.46 | 2,050 | 1,990 | 2,739 | 37 |
| JSL | 2,780 | -0.36 | 0.00 | -18.71 | 2,800 | 2,760 | 1,087 | 71 |
| 1D = 1 Day; 1M= 1 Month; MTD = Month-To-Date; YTD = Year-To-Date; Chg = Change; Vol = Volume; shr = share; Mkt cap = Market capitalization | ||||||||
Valuation Ratios
| EPS | BPS* | P/E | P/B | P/S | EV/EBITDA | ||
| ttm,mrq | (ttm,KHR) | KHR | (ttm,x) | (mrq,x) | (ttm,x) | (ttm,x) | |
| PPWSA | 2Q25 | 827 | 11,622 | 7.52 | 0.54 | 1.70 | 14.89 |
| GTI | 2Q25 | 29 | 7,023 | 244.34 | 1.01 | 0.87 | 40.01 |
| PPAP | 1Q25 | 2,951 | 22,115 | 4.60 | 0.61 | 1.57 | 3.96 |
| PPSP | 2Q25 | 735 | 4,376 | 2.79 | 0.47 | 0.94 | 2.07 |
| PAS | 1Q25 | 1,212 | 8,224 | 9.90 | 1.46 | 2.16 | 7.62 |
| ABC | 2Q25 | 1,460 | 14,410 | 4.64 | 0.47 | 0.81 | NA |
| PEPC* | 3Q25 | -1,445 | -1,303 | NA | NA | 3.08 | NA |
| MJQE | 2Q25 | 45 | 340 | 43.83 | 5.82 | 3.87 | 12.70 |
| CGSM | 2Q25 | 25 | 618 | 98.50 | 3.91 | 6.91 | 19.21 |
| JSL | 2Q25 | -82 | 492 | NA | 5.65 | 20.57 | 34.36 |
| DBDE | 2Q25 | 147 | 1,933 | 13.85 | 1.05 | 0.31 | 7.19 |
| NOTE: ttm= trailing-twelve months; mrq = most recent quarter; *FY ending in June, **excluding non-voting shares | |||||||
| Corporate Bonds |
Trading Summary
| Bond Symbol | Trading Vol (Units) | Trading Val (KHR'mn) | Latest Yield | Credit Rating | Bond Feature | Coupon Rate (%) | Days to Maturity |
| ABC32A | 0 | 0.0 | - - | khAA | Subordinated Bond | 8.50% | 2,332 |
| ABC32B | 0 | 0.0 | - - | KhAA | Subordinated Bond | 8.50% | 2,374 |
| CGSM33A | 0 | 0.0 | - - | KhAAA | Sustainability Bond | SOFR +3% or 5.5% per annum, whichever is higher | 2,994 |
| CIAF28A | 0 | 0.0 | - - | KhAAA | N/A | 6.30% Annually | 1,198 |
| CIAF30A | 0 | 0.0 | - - | KhAAA | Guaranteed Bond | 5.60% | 1,645 |
| GT27A | 0 | 0.0 | - - | N/A | Plain Bond, Green Bond | 7% per annum | 823 |
| PPSP29A | 0 | 0.0 | - - | KhAAA | Guaranteed Green Bond | Term SOFR + 1.5% | 1,385 |
| RRC32A | 0 | 0.0 | - - | N/A | Plain Bond | 7% Annually | 2,593 |
| RRGO27A | 0 | 0.0 | - - | KhAAA | Guaranteed Bond | SOFR+3,5% or 5% per annum (take which one is higher) | 840 |
| RRGT32B | 0 | 0.0 | - - | KhAAA | Guaranteed Bond | SOFR+3,5% or 5% per annum (take which one is higher) and Year 6 to Year 10: SOFR+3,75% or 5% per annum (take which one is higher) | 2,667 |
| SNTD40A | 0 | 0.0 | - - | N/A | Green Infrastructure Bond | 180-Day SOFR Average + 1.80% | 5,319 |
| SNTD40B | 0 | 0.0 | - - | N/A | Green Infrastructure Bond | 180-Day Average SOFR + 1.60% (4.00% - 6.00%) | 5,319 |
| SNTD40C | 0 | 0.0 | - - | N/A | Green Infrastructure Bond | 180-Day SOFR Average + 3.00% | 5,319 |
| Government Bonds |
Historical Issuance Summary
| 1 Y | 2 Y | 3 Y | 5 Y | 10 Y | |
| Total issuance ('K units) | 238.1 | 312.0 | 187.3 | 18.0 | 0.0 |
| Outstanding (KHR'bn) | 58.0 | 208.0 | 187.3 | 18.0 | 0.0 |
| Issuance ('K units, Latest) | 34.0 | 0.0 | 12.0 | 8.0 | 0.0 |
| Coupon rate (Latest) | 2.70% | 3.20% | 3.50% | 4.34% | 4.60% |
| Successful yield (Latest) | 3.25% | - | 3.50% | 5.00% | - |
| Latest bidding | 23-Apr-25 | 21-May-25 | 25-Jun-25 | 45,861 | 45,889 |
| *Total issuance is the accumulated issuance since September 2022; **Outstanding is aggregate principal value of government that remain outstanding; ***Successful yield: mid yields are shown if multiple price auction method was adopted. | |||||
| Stock Charts |
Main Board
Growth Board